1. How to Create a vertical bar chart
1.1 Create a bar chart object
We first include the chart library in our project, and then create a chart object of dimensions 500 x 250 pixels. If not specified, the image dimensions will be defaulted to sensible values. There are currently 4 types of charts : VerticalBarChart, HorizontalBarChart, LineChart and PieChart.
	include "libchart/libchart.php";

	$chart = new VerticalBarChart(500, 250);
1.2 Create some bars
We add 4 bars to our chart. For that we create a data set and add some bars to it. Each bar is a (label, value) couple, that we call here a Point.
	$dataSet = new XYDataSet();
	$dataSet->addPoint(new Point("Jan 2005", 273));
	$dataSet->addPoint(new Point("Feb 2005", 321));
	$dataSet->addPoint(new Point("March 2005", 442));
	$dataSet->addPoint(new Point("April 2005", 711));
Then we link the data set to the chart:
$chart->setDataSet($dataSet);
1.3 Display the chart
We set the title and then render the chart to a PNG image.
	$chart->setTitle("Monthly usage for www.example.com");
	$chart->render("generated/demo1.png");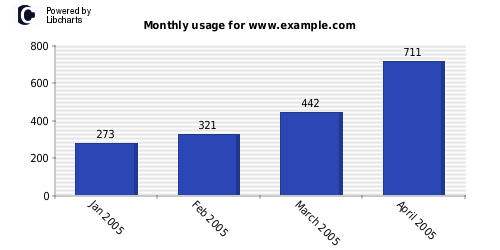
...et voilà!
2. How to create a horizontal bar chart
Creating a horizontal bar chart is similar to the previous example.
Here is the source code and the corresponding result.
	$chart = new HorizontalBarChart(500, 170);

	$dataSet = new XYDataSet();
	$dataSet->addPoint(new Point("/wiki/Instant_messenger", 50));
	$dataSet->addPoint(new Point("/wiki/Web_Browser", 83));
	$dataSet->addPoint(new Point("/wiki/World_Wide_Web", 142));
	$chart->setDataSet($dataSet);

	$chart->setTitle("Most visited pages for www.example.com");
	$chart->render("generated/demo2.png");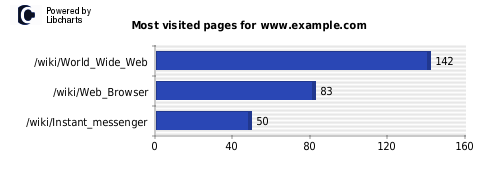
3. How to create a pie chart
In order to create a pie chart, we enter 3 points and their associated absolute values. Corresponding percentages are computed automatically.
	$chart = new PieChart(500, 250);

	$dataSet = new XYDataSet();
	$dataSet->addPoint(new Point("Mozilla Firefox (80)", 80));
	$dataSet->addPoint(new Point("Konqueror (75)", 75));
	$dataSet->addPoint(new Point("Other (50)", 50));
	$chart->setDataSet($dataSet);

	$chart->setTitle("User agents for www.example.com");
	$chart->render("generated/demo3.png");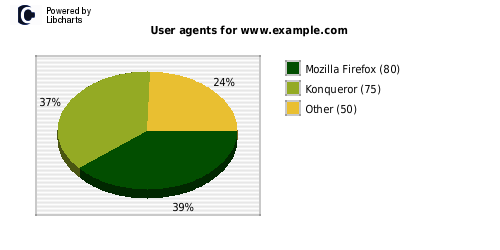
4. How to create a multiple line chart
We already saw how to create a XYDataSet. There is another kind of dataset, XYSeriesDataSet, which allows for several lines/bars concurrently. A XYSeriesDataSet is really a container for several XYDataSet. Here is how it goes:
4.1 Create some series
We create several XYDataSets as earlier.
	include "../libchart/classes/libchart.php";

	$chart = new LineChart(500, 250);

	$serie1 = new XYDataSet();
	$serie1->addPoint(new Point("06-01", 273));
	$serie1->addPoint(new Point("06-02", 421));
	$serie1->addPoint(new Point("06-03", 642));
	$serie1->addPoint(new Point("06-04", 799));
	$serie1->addPoint(new Point("06-05", 1009));
	$serie1->addPoint(new Point("06-06", 1106));

	$serie2 = new XYDataSet();
	$serie2->addPoint(new Point("06-01", 280));
	$serie2->addPoint(new Point("06-02", 300));
	$serie2->addPoint(new Point("06-03", 212));
	$serie2->addPoint(new Point("06-04", 542));
	$serie2->addPoint(new Point("06-05", 600));
	$serie2->addPoint(new Point("06-06", 850));
4.2 Create a XYSeriesDataSet
Then we create a XYSeriesDataSet and add our two series to it. Then we link our main data set to the chart.
	$dataSet = new XYSeriesDataSet();
	$dataSet->addSerie("Product 1", $serie1);
	$dataSet->addSerie("Product 2", $serie2);
	$chart->setDataSet($dataSet);
4.3 Render the chart
We render the chart as usual:
	$chart->setTitle("Sales for 2006");
	$chart->render("generated/demo4.png");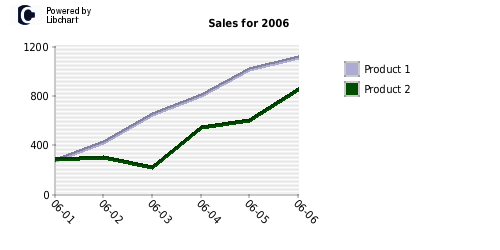
You can try out XYSeriesDataSet in conjunction with HorizontalBarChart and VerticalBarChart too!
5. How to customize
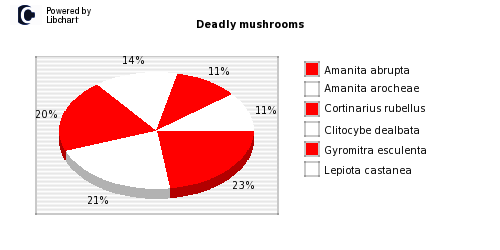
5.1 Changing the colors
We can change the colors for each type of chart via the Palette object.
Let's go back to the previous Pie Chart code, and tweak it a bit!
	$chart = new PieChart(500, 250);

	$chart->getPlot()->getPalette()->setPieColor(array(
		new Color(255, 0, 0),
		new Color(255, 255, 255)
	));

	$dataSet = new XYDataSet();
	$dataSet->addPoint(new Point("Amanita abrupta", 80));
	$dataSet->addPoint(new Point("Amanita arocheae", 75));
	$dataSet->addPoint(new Point("Clitocybe dealbata", 50));
	$dataSet->addPoint(new Point("Cortinarius rubellus", 70));
	$dataSet->addPoint(new Point("Gyromitra esculenta", 37));
	$dataSet->addPoint(new Point("Lepiota castanea", 37));
	$chart->setDataSet($dataSet);

	$chart->setTitle("Deadly mushrooms");
	$chart->render("generated/demo5.png");
We can add as many (or as few) colors as we like. Notice how the colors cycle if we have more items than the number of colors defined.